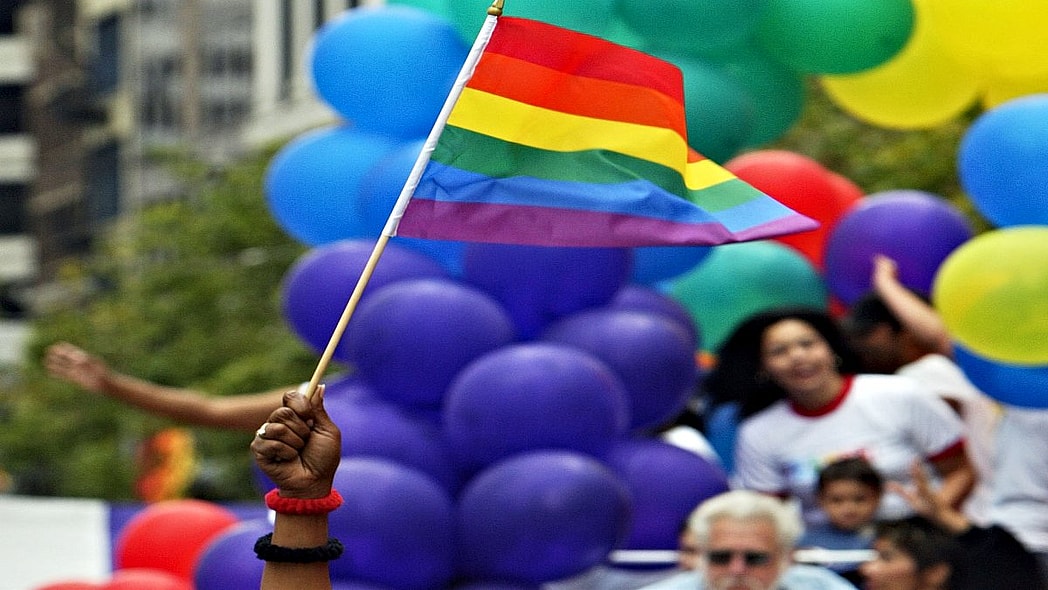
According to a new national survey, most LGBTQ Americans don’t want a brown and/or black stripe added to the rainbow pride flag.
The poll, taken by 880 LGBTQ adults from around the United States is touted as being one of the most “comprehensive national polls to date on how LGBTQ Americans live in 2018.”
The results found that gay men, white people, and Baby Boomers were most resistant to updating the Pride flag by adding a black or brown stripe to represent LGBTQ people of color. Meanwhile millennials and nonwhite LGBTQ people were more inclined to support inclusivity.
The research was conducted by Whitman Insight Strategies and BuzzFeed News as part of a larger LGBTQ survey on how life, politics, and identity underlines the racial bias that continues to be an issue even in the gay community.
A fuzzy memory
LGBTQ people of color have long complained that the movements that have propelled the whole community forward have heavily depended on their activism yet whitewashed their contributions when retold to the general public.
READ MORE: Black astronaut speaks out about being removed from international space mission
A prime example of this erasure is the 2015 movie Stonewall, which falsely portrayed a white man at the forefront of the LGBTQ movement while downplaying the massive role people of color and transgender women played in galvanizing support and national attention.
LGBTQ bars and establishments have long been accused of racial discrimination, and showing blatant favoritism to gay white men above all others.
This ongoing bias is why people of color in Philadelphia’s LGBTQ community decided to fly the Pride flag with an additional brown and black stripe at City Hall in June of 2017 to promote the message, “More color, more pride.”
By the numbers
That seemingly small change, created by artist Gilbert Baker in 1978, received a lot of pushback and caused debate within the community. A debate that continues to rage on a year later.
Researchers found that 58 percent oppose the new stripes, while 42 percent support them. The majority of the opposition came from among gay men and those over 50 with both groups opposing the additional colors. White LGBTQ people opposed the change 62 percent to 38 percent.
Support was much stronger among lesbians and bisexuals than among gay men with 41 percent of lesbians and 47 percent of bisexuals saying that they support the new stripes.
The study found that the biggest split in support was generational. LGBTQ people between the ages of 18 and 29 favored the more inclusive flag — 53 percent support and 47 percent oppose — while less than 20 percent of Baby Boomers agree.


